Key Features
Everything you need to go from data to published chart.
AI handles the writing. You stay in control of everything else.
Data Upload
Paste data directly, import a CSV, connect via API, or let AI generate sample data from a plain-English description. Your data works however you do.

Chart Designer
Choose from 10+ chart types — bar, line, column, pie, doughnut, area, bubble, radar, funnel, timeline, and combination. Switch types without losing your data or settings.

Branding & Styling
Upload your logos, set your colour palette, choose your fonts. Every chart you create automatically reflects your brand — no manual adjustments, ever.
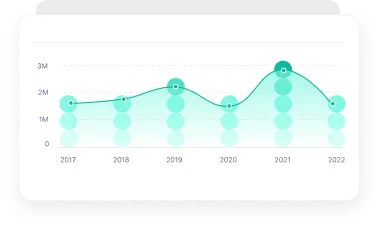
Chart Collections
Build a set of consistently styled charts from one setup. Perfect for reports, recurring content, and data journalism where every chart needs to look like it belongs together.
Customisation
Fine-tune axes, grid lines, labels, annotations, colours, and layout — down to the pixel. Or let the defaults do the work. Either way, the output is publication quality.
Publishing & Embedding
One click generates a responsive iframe embed code — mobile-optimised, with your AI-written accessibility label built in. Configure tooltips, social sharing, and downloads per chart.
Chart Gallery
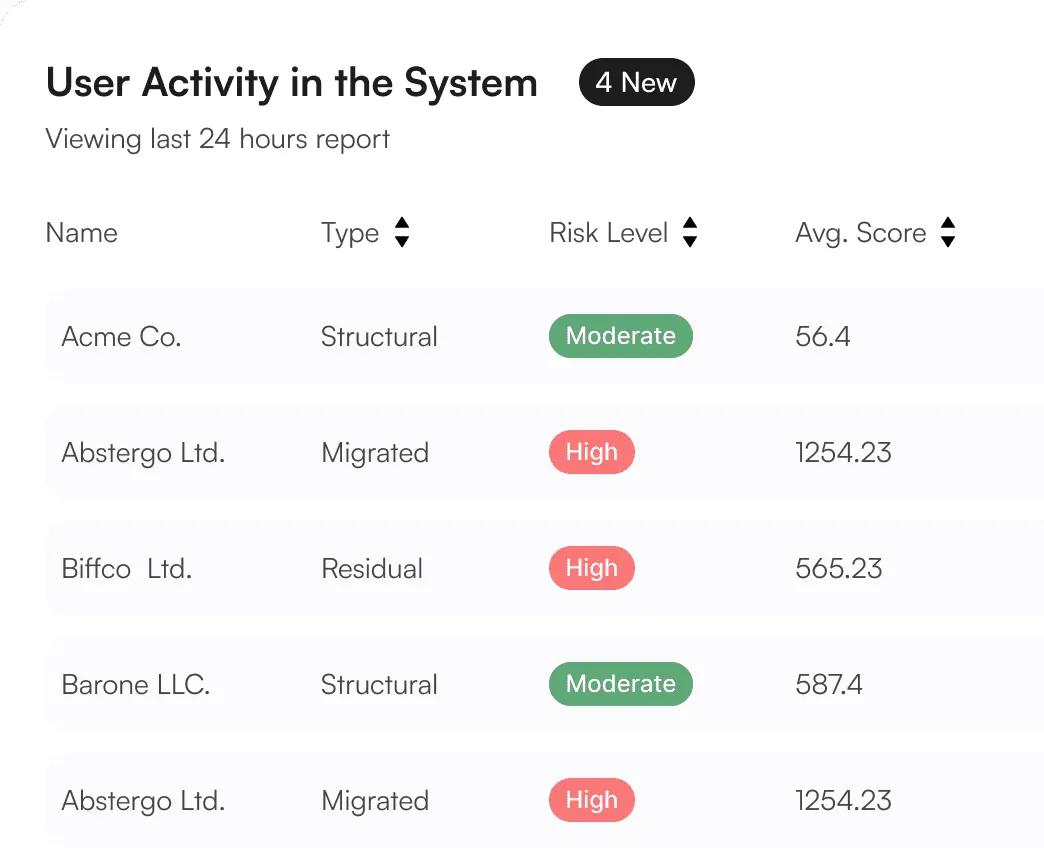
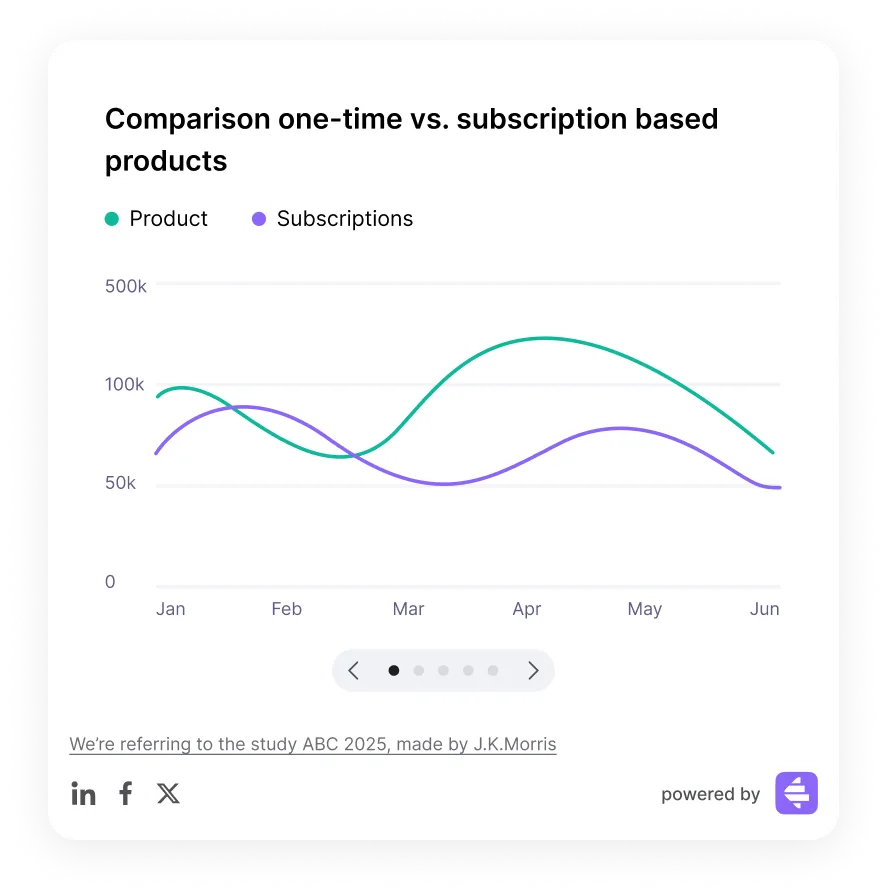
Charts that are ready to publish.
Every chart AI Chart Studio produces is clean, on-brand, and embed-ready. No design skills required.
Monthly revenue by region, Q1–Q4
User growth over 12 months
Market share by product category
Website traffic trends, Jan–Jun
Sales conversion pipeline
Quarterly earnings comparison
How it works
Three steps from data to a published chart.
Import your data, pick your chart type, let AI write the rest. That's it.
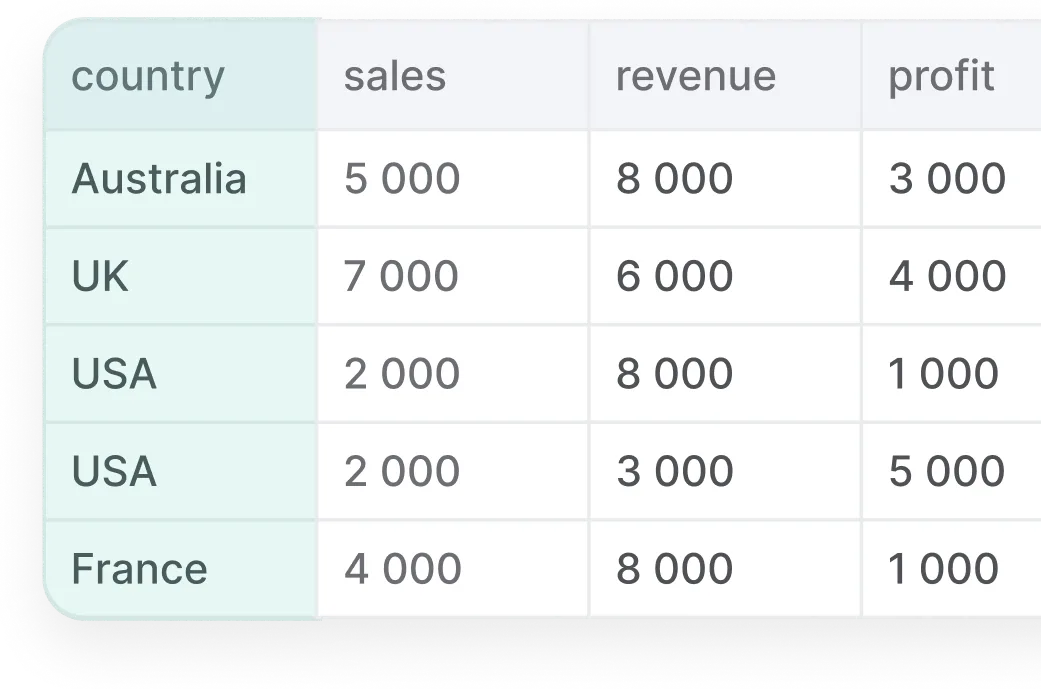
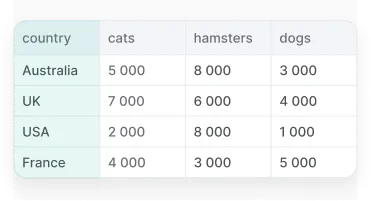
Step 1 · Bring your data
Paste or type directly into the editor, import a CSV, or describe what you want in plain English. AI Chart Studio handles the rest.
Multiple Import Options
Paste, type, upload a CSV or Excel file, or connect an API.
Smart Data Recognition
Automatic detection and formatting of your data types.
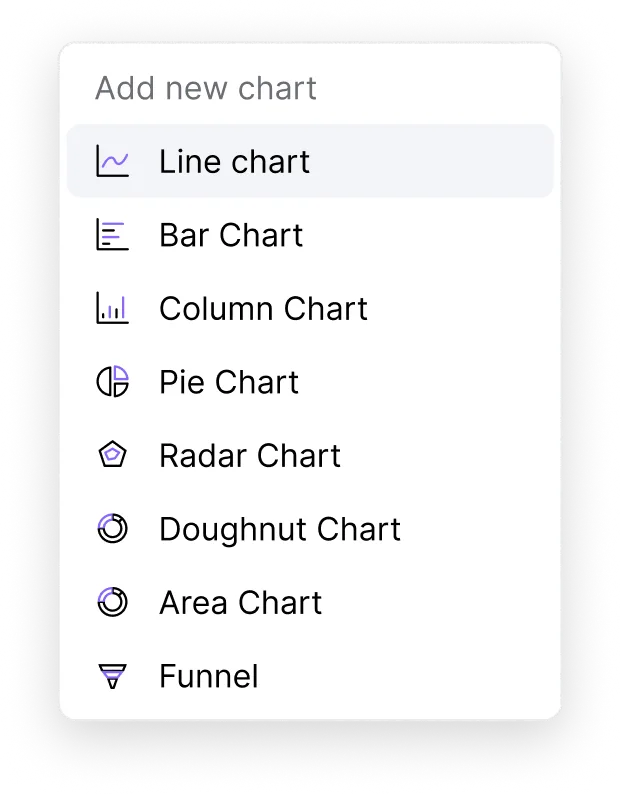
Step 2 · Pick your chart type
Choose from 10+ chart types and pick the one that fits your data. AI Chart Studio sets up the right layout, axis labels, and formatting automatically.
Real-time preview as you make changes.
Switch chart types without losing your data or settings.
Step 3 · Let AI write the rest
Hit ‘Generate text’ and AI writes your chart title, description, footnote, and accessibility alt text — based on your actual data. Edit anything, or publish as-is. Copy the embed code and you're live.
AI-written title, description, footnote, and alt text.
Grounded in your real data — edit anything before you publish.
Copy the embed code and you're live.
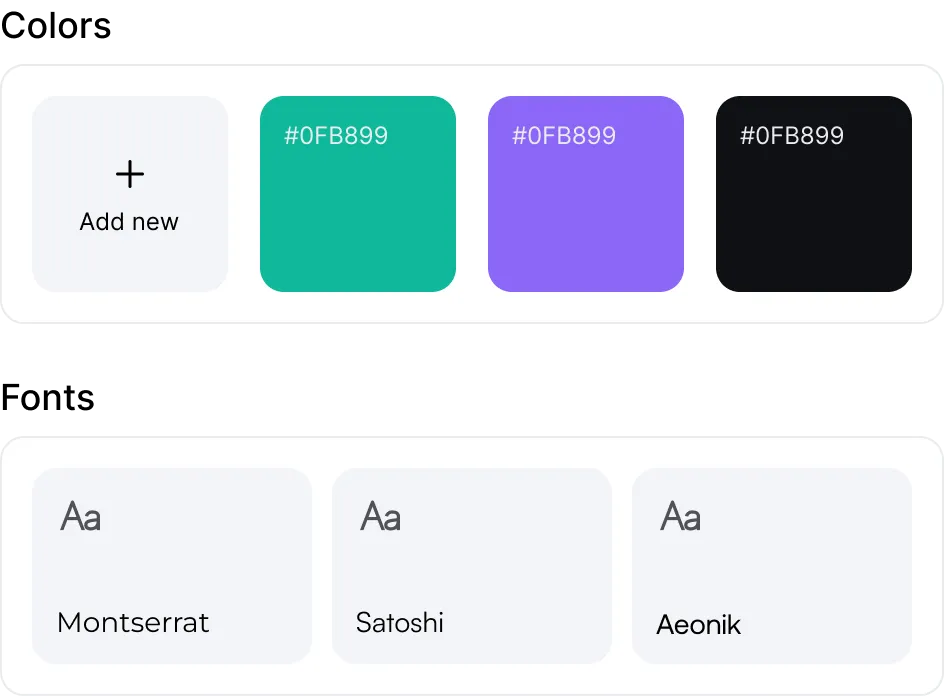
Branding & Styling
Your Brand Kit lives in AI Chart Studio. Upload your logo, set your exact colours, choose your fonts — and every chart you create, now and in the future, reflects your brand automatically.
Custom Brand Themes
Save your colours, fonts, and styles once, then apply them everywhere.
Logo Integration
Your logo, added to every chart automatically.
Font Library
Premium typefaces including Montserrat, Satoshi, Aeonik, and more.
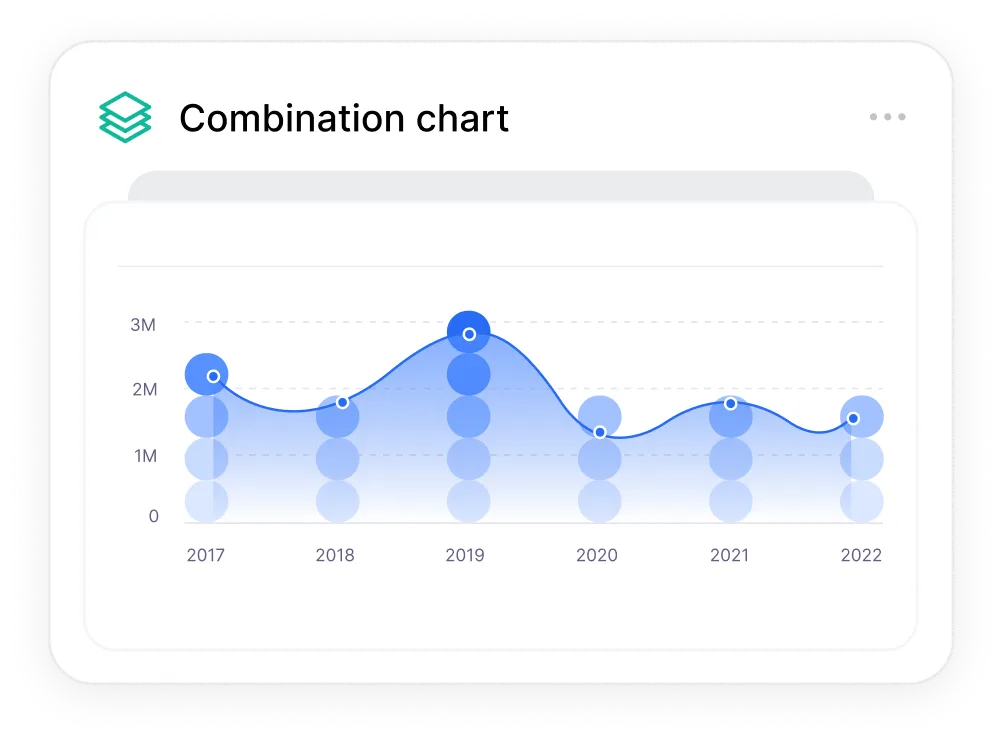
Chart Collections
Some stories need more than one chart. Build a collection from a single setup — every chart perfectly matched in style. Ideal for editorial series, quarterly reports, and recurring data content.
Create once. Reuse for every update.
Batch-style multiple datasets with identical visual styling.
Live data connections — your charts update automatically when the source data changes.
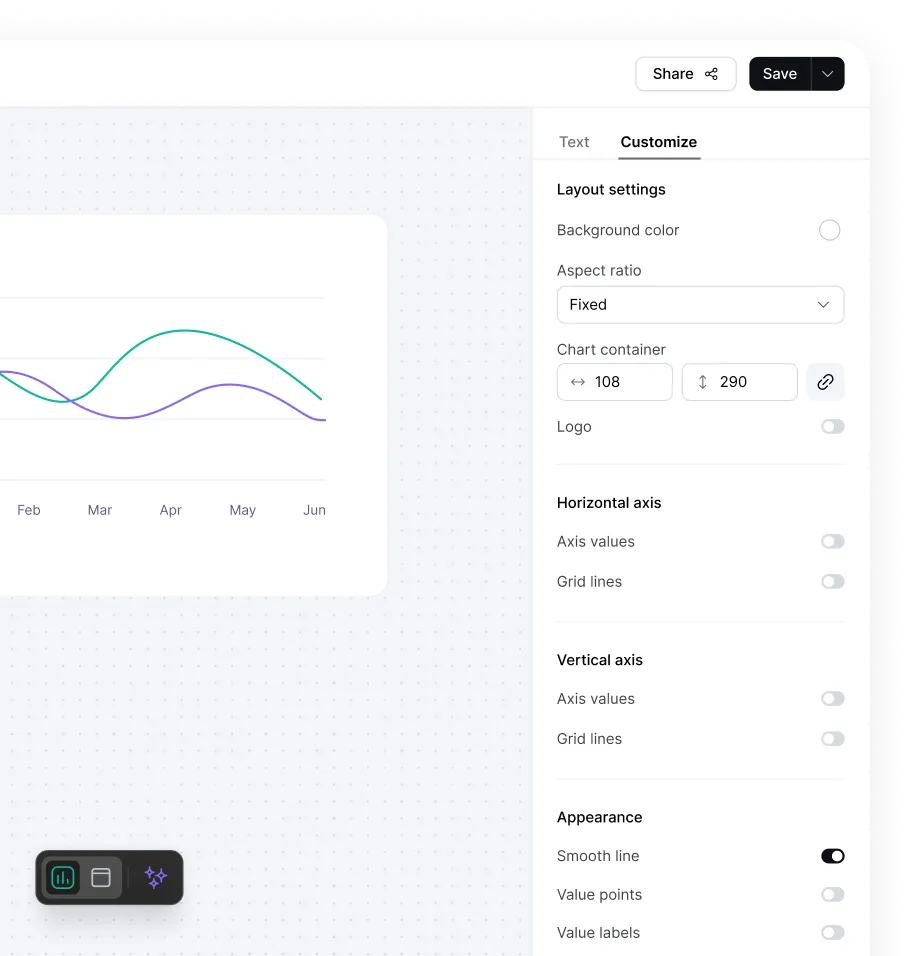
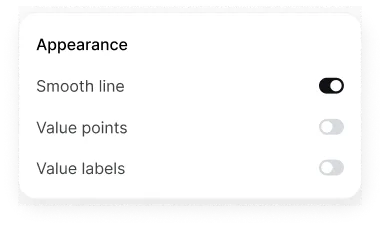
Customisation
Every axis, label, colour, layout, and annotation is under your control. Adjust aspect ratio for editorial, social, or presentation formats. The output is always publication quality — whether you tweak everything or nothing.
Detailed Controls
Axes, grid lines, labels, colours, and layout.
Custom Annotations
Add text, arrows, and shapes to highlight the insight.
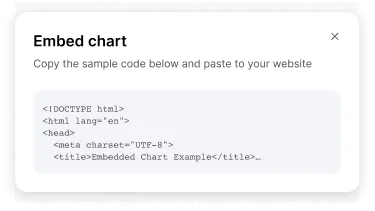
Publishing & Embedding
Every chart generates a responsive embed code — one click, paste anywhere. Charts are mobile-optimised from the start, include your AI-generated accessibility label, and can be configured for tooltips, social sharing, and viewer downloads.
One-click embed for any website or CMS.
Responsive on every device, automatically.
AI-generated alt text in every embed — WCAG accessible by default.

From data to insight,
in the blink of AI.
AI Chart Studio helps teams transform raw data into persuasive, presentation-ready charts at scale.
Try it freeNo setup required · From $19/month